
Today report
Bring steps, active hours, heart rate, sleep, oxygen, HRV, and breathing into one daily overview. Open individual metrics to explore the readings and trends behind your day.
The next FitSignals beta brings Google Pixel Watch and Fitbit history into focus through the Google Health API. Explore your patterns with Today and Sleep reports, AI chat and analysis, and 18 focused reports on sleep, recovery, heart rate, and activity.
For Google Pixel Watch and Fitbit. Beta participation details will be shared before testing opens.
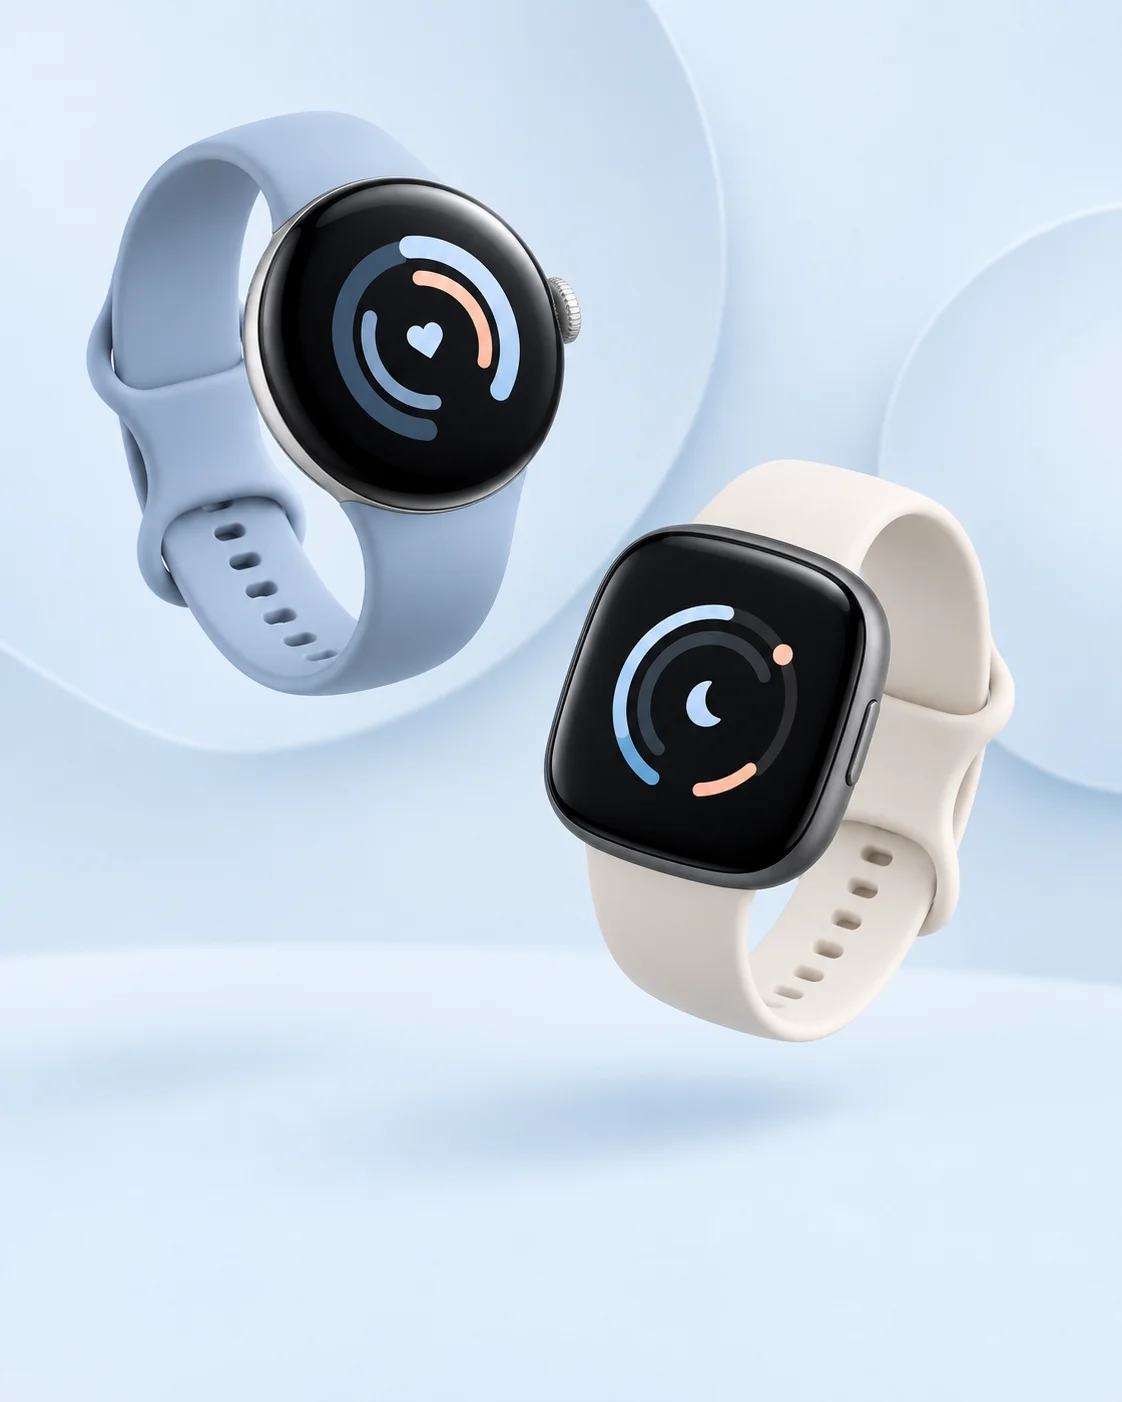
The new FitSignals project turns recorded watch data into useful reports. See your day at a glance, explore a night in detail, or ask a question about your history.
Bring steps, active hours, heart rate, sleep, oxygen, HRV, and breathing into one daily overview. Open individual metrics to explore the readings and trends behind your day.
Explore nightly sleep stages, bedtimes, wake times, interruptions, and overnight heart rate, oxygen, HRV, and breathing. Rolling 90-day charts put each night in context.
Ask questions in plain language about your recorded data. Explore how your sleep changed this month or how steps relate to next-night sleep, then preview and save AI-generated reports to revisit.
A report library for comparing weeks and months, understanding your sleep, and seeing how your metrics move together.
Compare recent weeks and months with earlier periods, and see how your readings sit alongside your personal baseline.
Explore sleep timing, interruptions, consistency, and catch-up sleep in the context of your own history.
Bring overnight HRV, resting heart rate, oxygen, breathing, and sleep together against your personal baselines.
Explore your typical 24-hour heart-rate profile, recent trends, and how resting heart rate changes after recorded cardio.
Discover hourly activity patterns, compare weekdays with weekends, and follow progress toward your chosen goals.
Review monthly trends across up to a year of available history, or prepare a printable or CSV health summary.
Reports depend on the signals and history your watch has recorded and on Google Health availability. Data coverage helps put results in context. Relationships between metrics show associations, not causes.
The new app connects to your available Google Pixel Watch or Fitbit history through Google Health, starting with your permission.
Create a FitSignals account and approve Google Health access to your available watch data.
The app imports available records. Source and sync status show what has arrived and how much history is available.
Start with Today or Sleep, then explore focused reports, personal baselines, and patterns over time.
This describes the new app experience. Beta access and participation details will be shared separately.
Our first FitSignals beta used the Fitbit Web API. That hosted beta has concluded, and the next chapter is being built around the Google Health API. Thank you to everyone who took part and shared feedback. Read Google's API transition overview.
The hosted Fitbit beta is no longer running.
The new Google Health API project brings together daily reports, sleep analysis, AI chat, and a deeper report library.
We want to understand the questions, reports, and visualizations that matter to you.
A new testing phase is planned. A launch date has not been announced.
These screenshots are from the earlier Fitbit Web API beta. They document our previous work and are not screenshots of the new Google Health API product. Select an image to view it at full size.
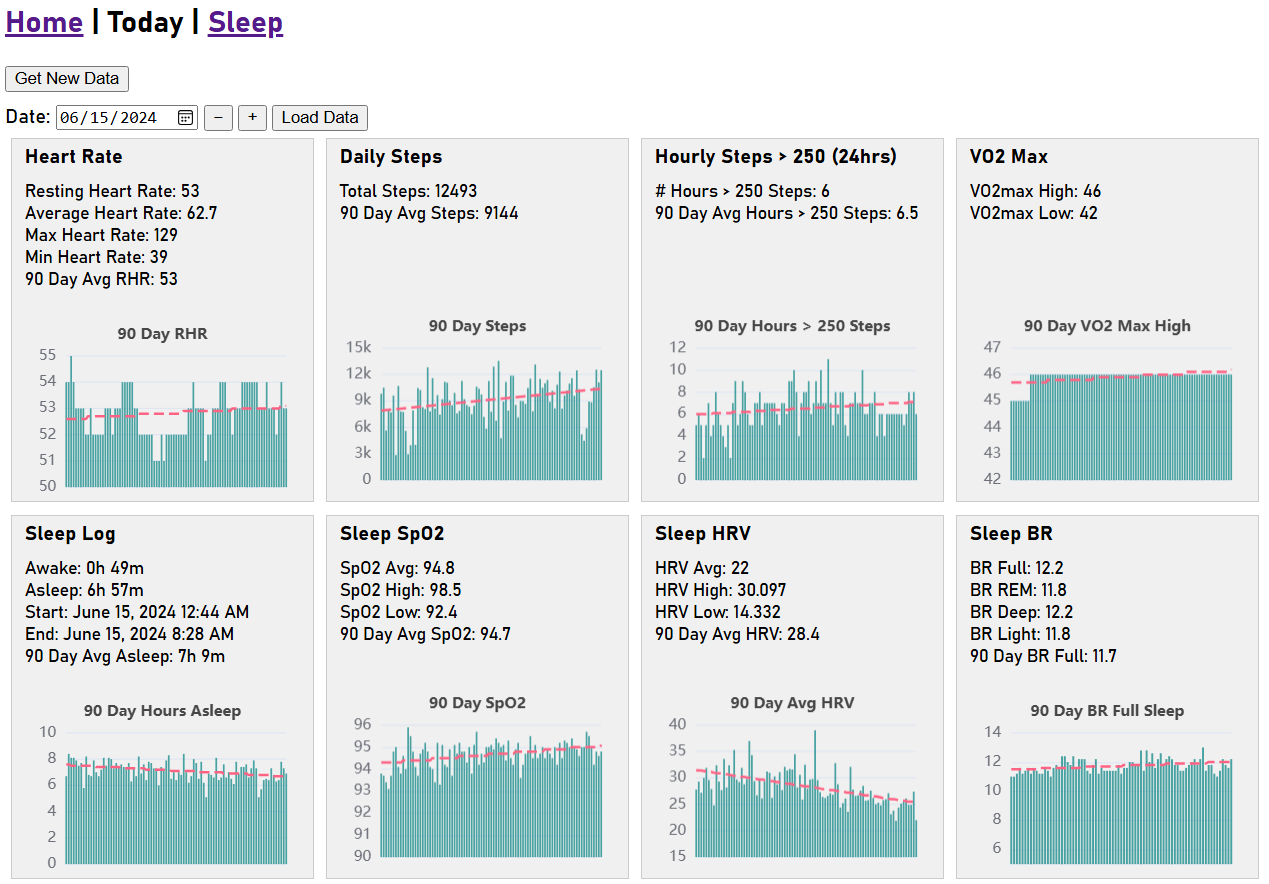
View key metrics for today and the past 90 days to track recent trends for selected date.
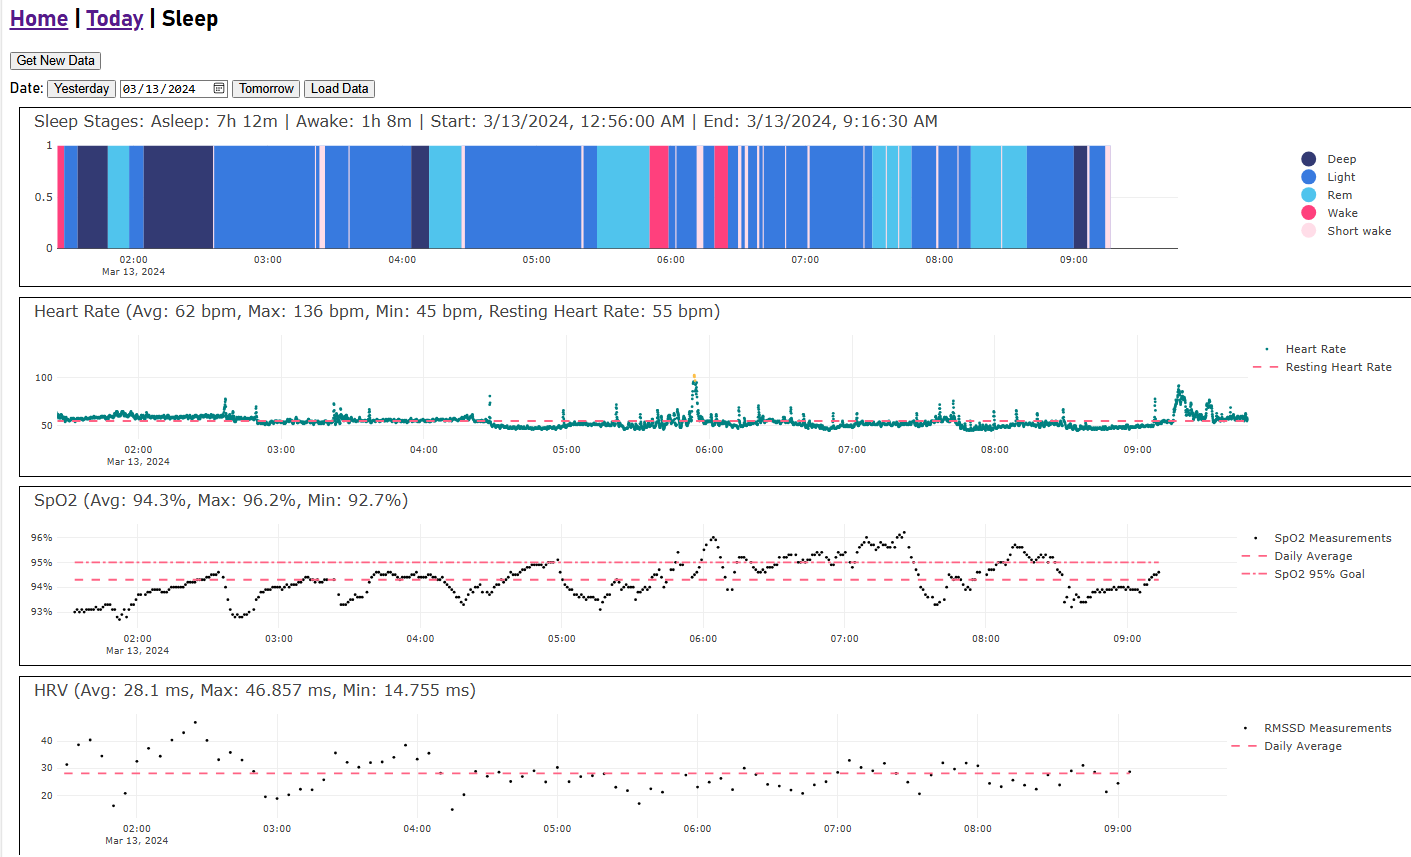
View detailed nightly sleep data for sleep stage, HRV, SpO2 and heart rate for selected date.
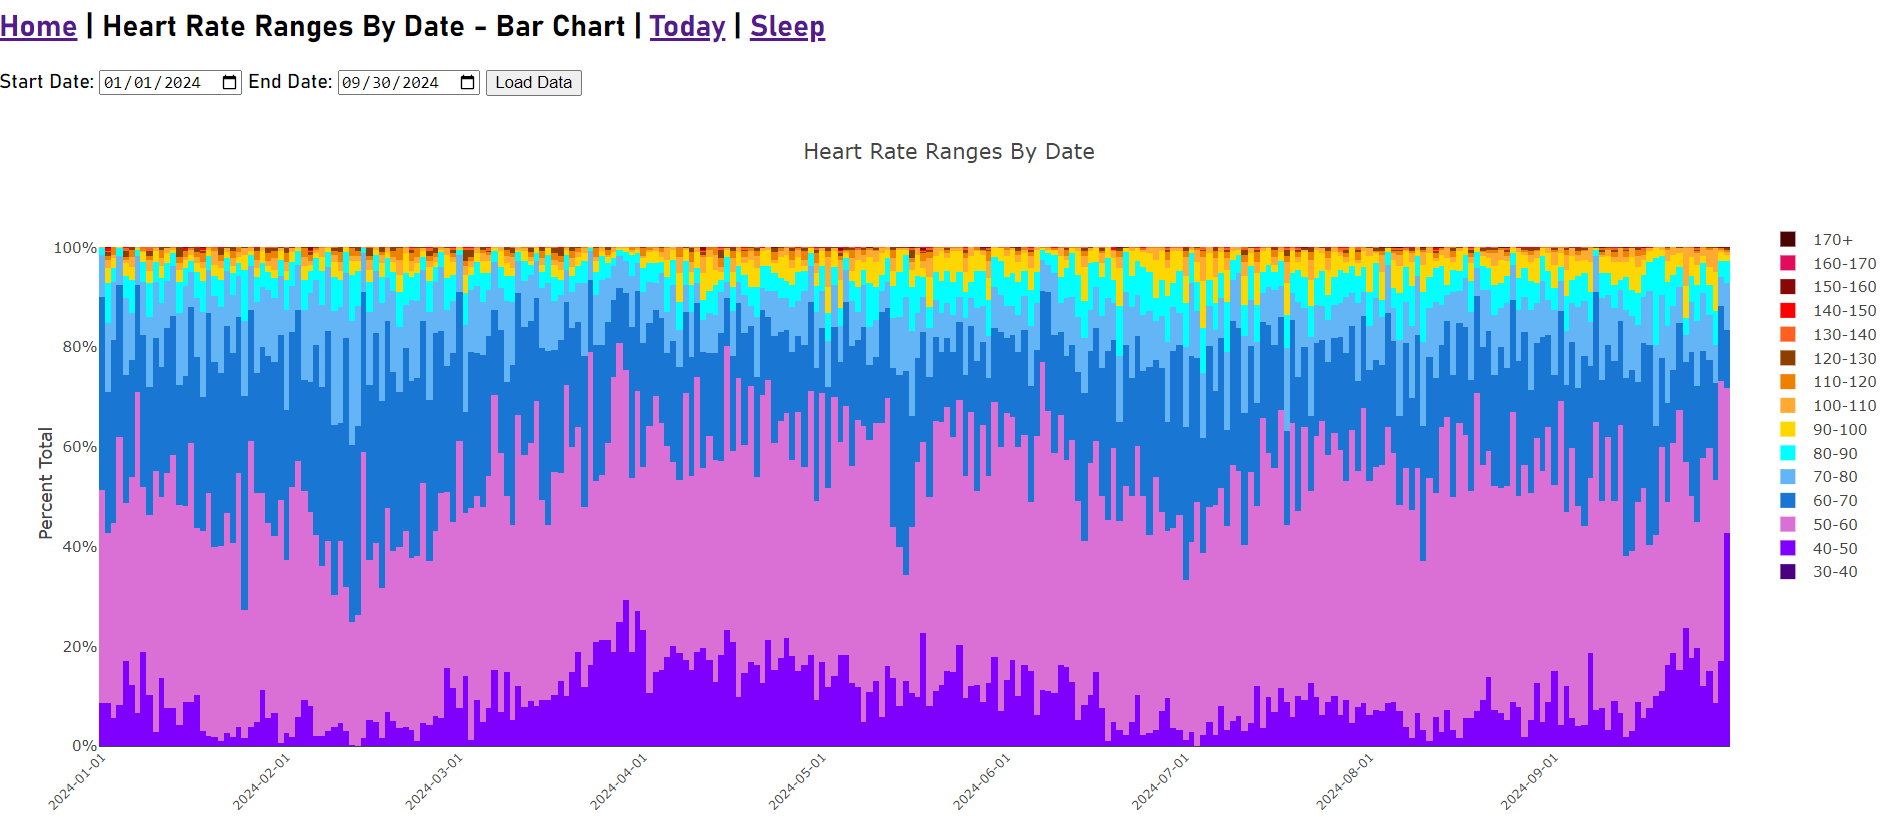
View daily heart rate zone ranges for selected date range.
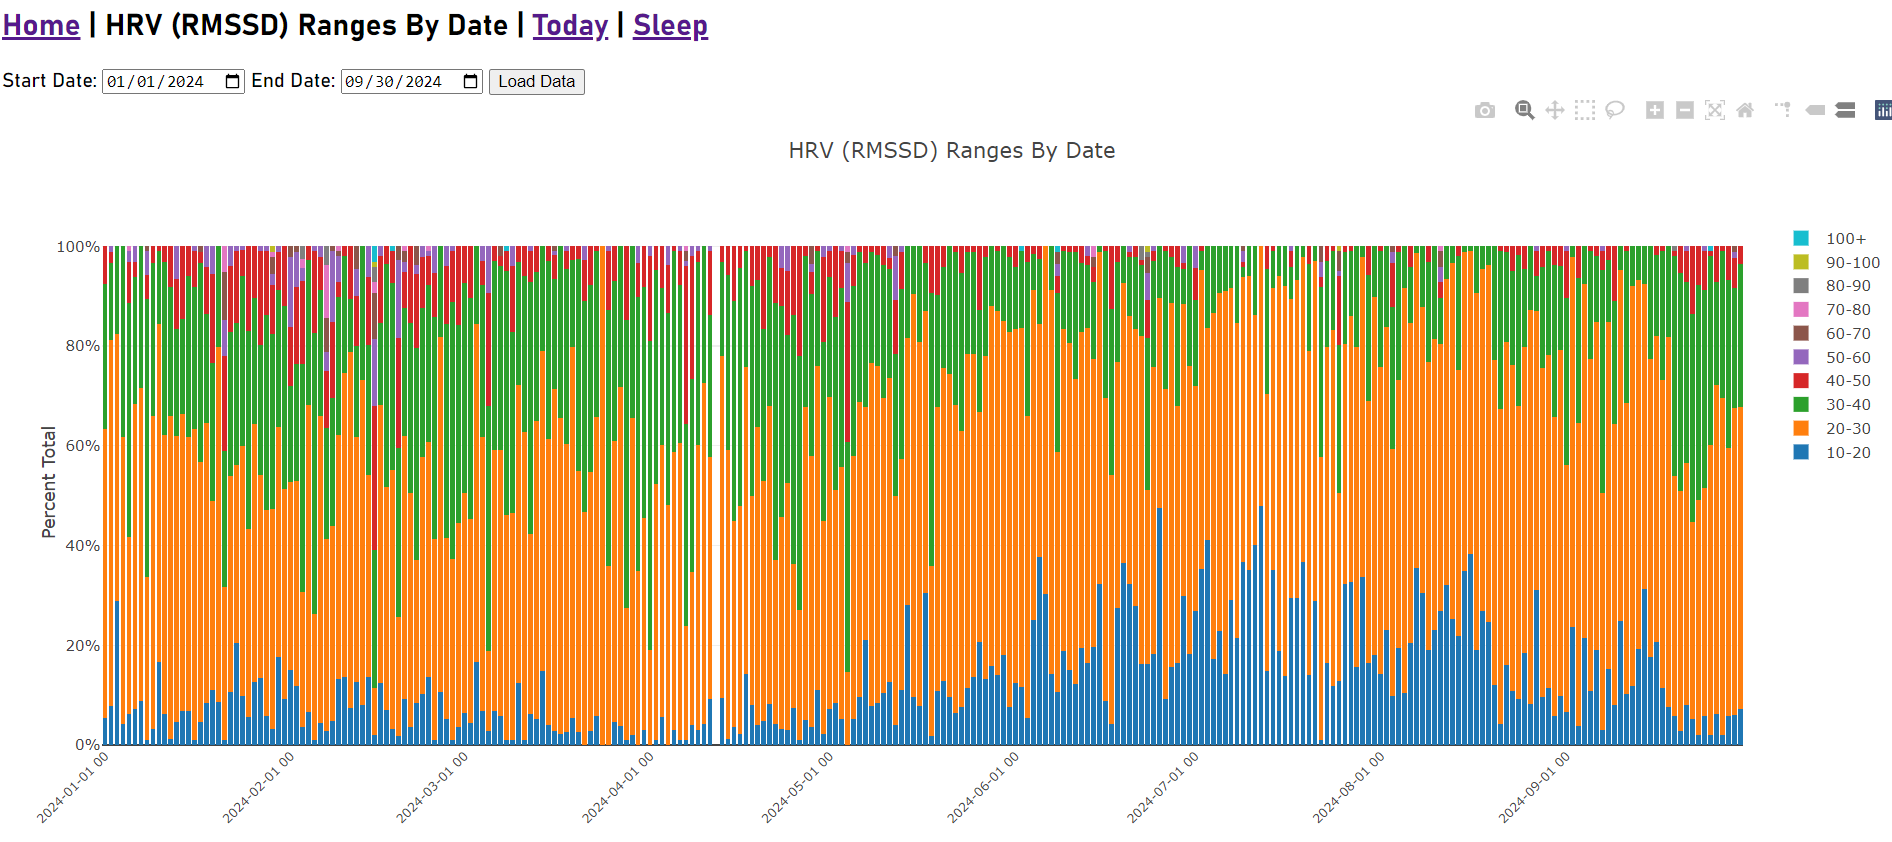
View daily heart rate variability ranges for selected date range.
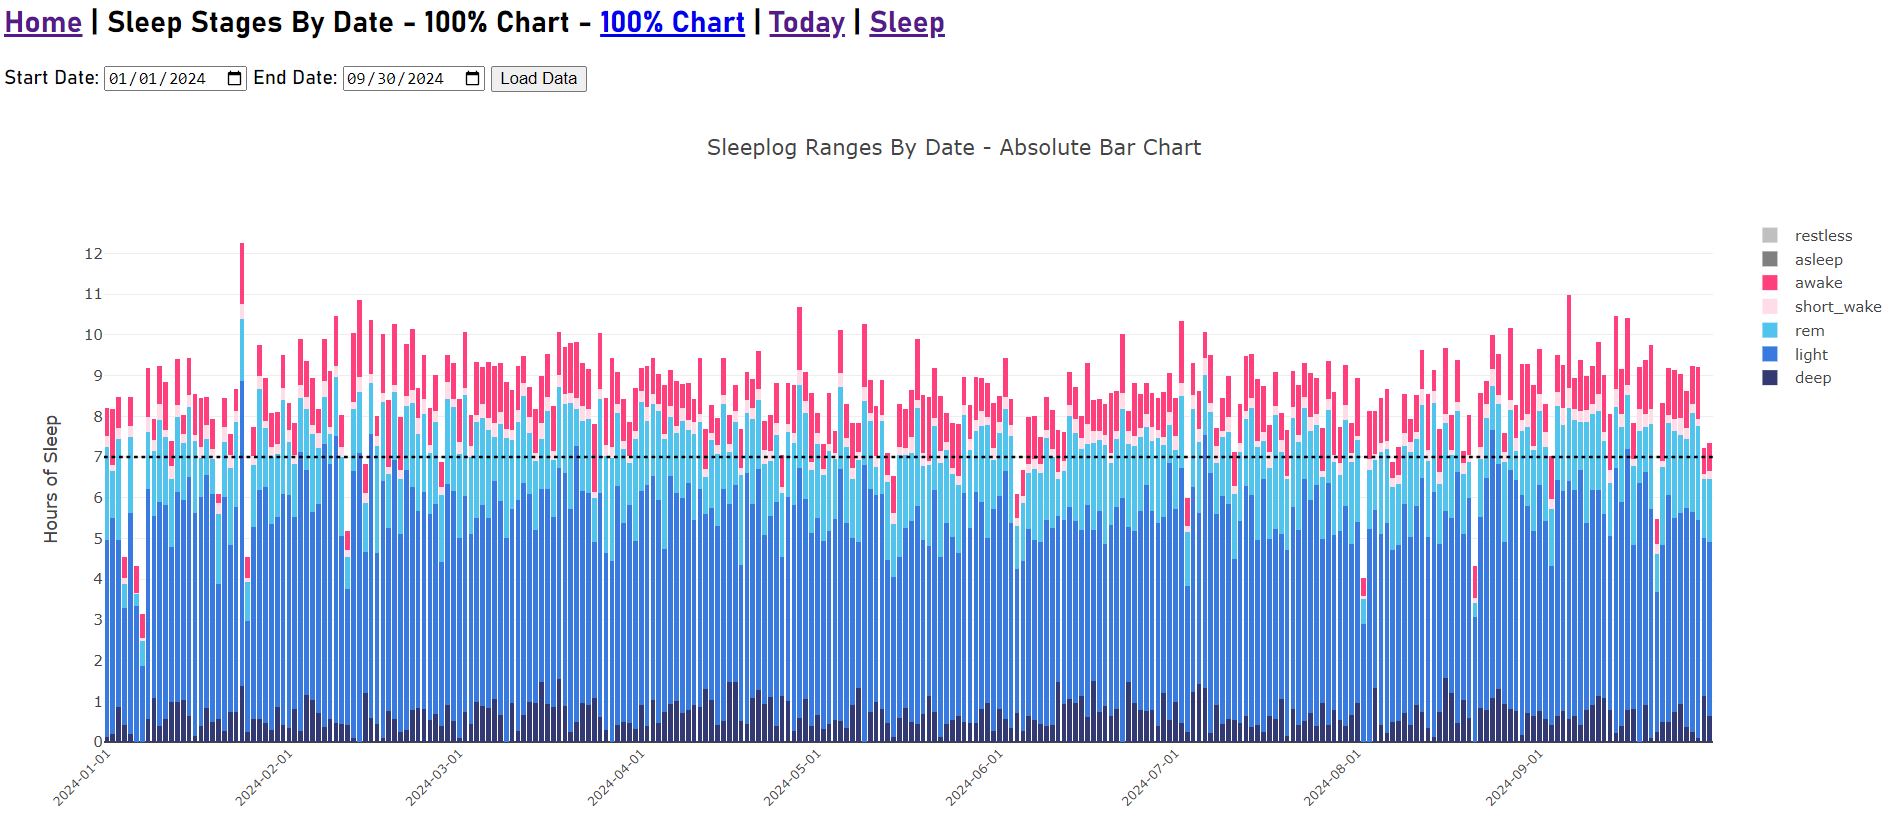
View nightly sleep stage ranges for selected date range.
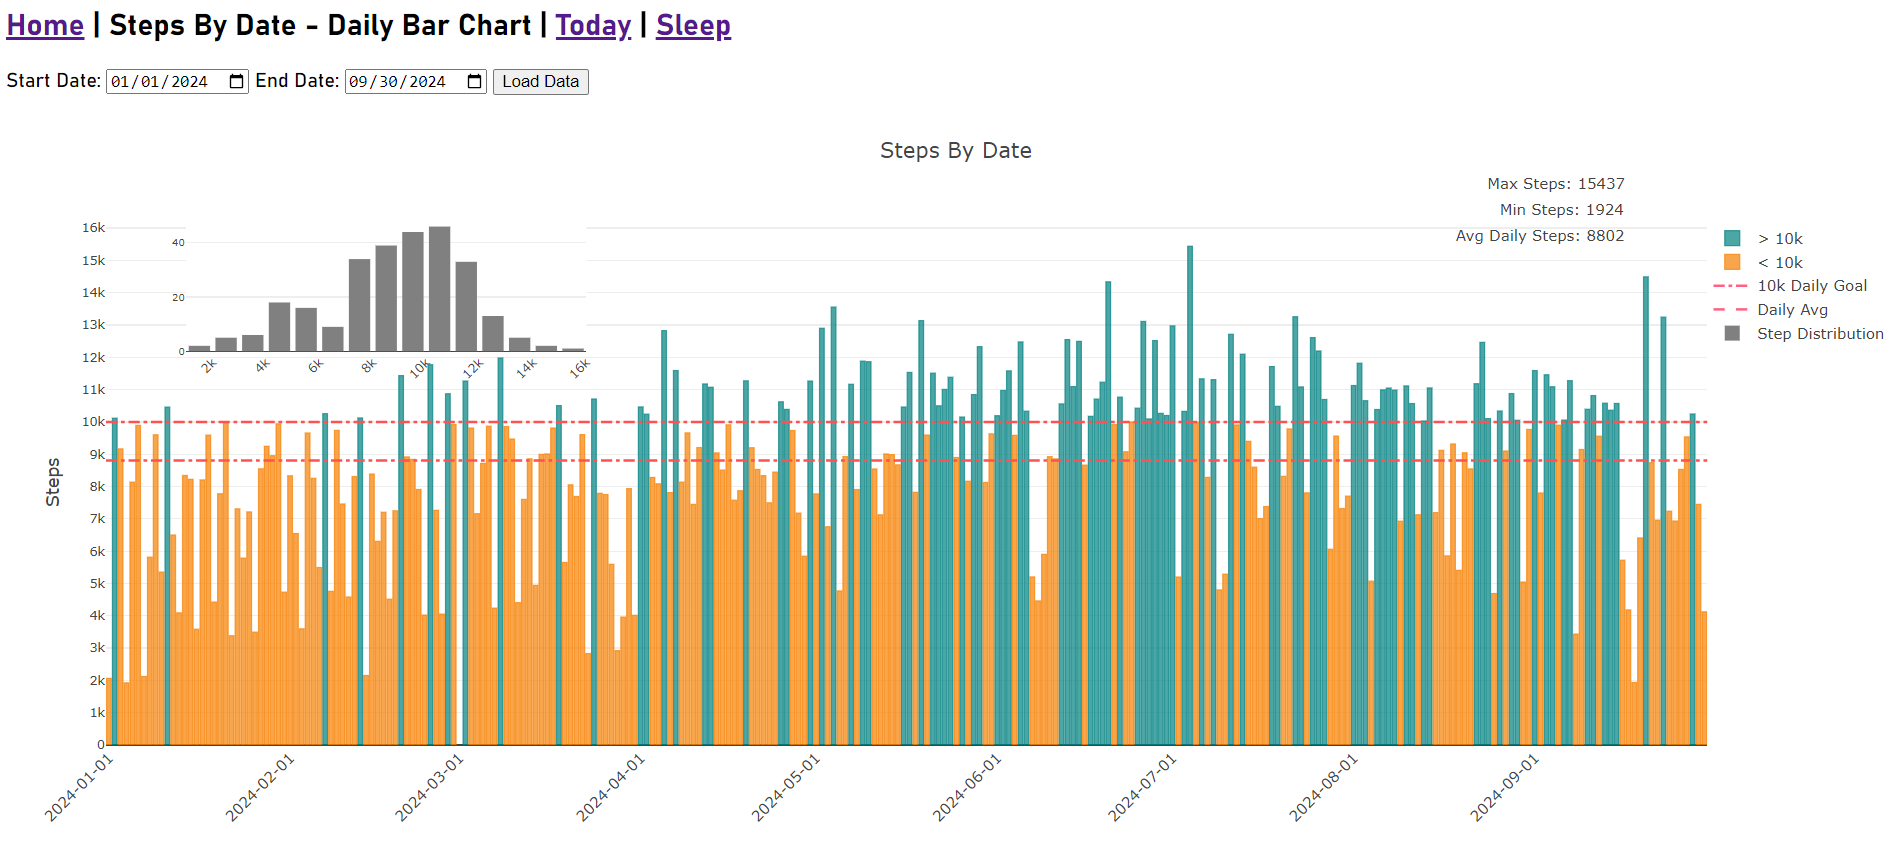
View daily step counts and daily step max, min, avg and distribution for selected date range.
We are actively looking for people to join our beta. To join the waitlist or ask a question, contact
[email protected]Details about participation, data access, and privacy will be provided before the next beta opens. This page does not connect to your Fitbit or Google Health account.